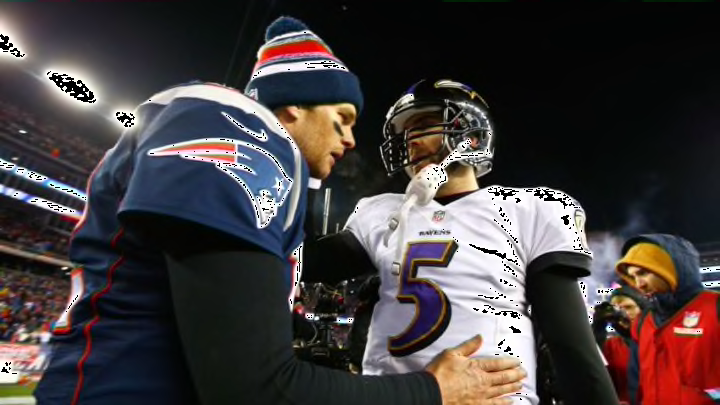
Joe Flacco: How does he compare to the G.O.A.T?

But, in the five seasons since that Super Bowl victory in 2013, the Ravens are a combined 38-36, barely a .500 team. The year after the Super Bowl was particularly miserable for the Ravens as they went 8-8 and Joe Flacco mustered a measly 73.1 passer rating, the worst of his career. Can you say Super Bowl hangover?
That record can’t all be blamed on Flacco, though, as that was the year Ed Reed left along with the retirements of Ray Lewis and Todd Heap. The vaunted defense was in a transitional period and the entire team had to adjust. Which they did, admirably, as the next season saw Flacco throw for 27 touchdowns and a 91.0 passer rating, earning him a Pro Bowl invite (which he declined to be at the birth of his son).
Must Read: Ravens Free Agency 2018: 3 reasonable wide receiver targets
And in the three seasons after that Pro Bowl season? Steady Joe again, averaging 3,416 yards and an 82.4 passer rating. For comparison, here’s a look at his numbers again in the five seasons up to that Super Bowl victory:
AVERAGE SEASON (2008-2012)
RECORD
COMP%
YDS
TD
INT
RATING
JOE FLACCO
54-26
60.5
3,527
20
11
86.3
And here’s a look at his numbers in the five seasons since:
AVERAGE SEASON (2013-2017)
RECORD
COMP%
YDS
TD
INT
RATING
JOE FLACCO
38-36
62.8
3629
20
15
82.1
Wait… those aren’t so different, right? No, they’re not. But one big number jumps out: those four extra interceptions per year, leading to a decreased passer rating. But that shouldn’t account solely for the Ravens woes. With the exception of that 2013 season, Flacco’s numbers are reasonably stable. The real question is, why hasn’t he gotten better?
While Flacco has remained mostly the same, if not some signs of regression, Brady’s career has vaulted into the pantheon of not just football, but all-time sports greats. Since 2006, Brady has averaged a 64.8% completion rate, 4010 yards per season, 30 touchdowns, and a 101.3 passer rating. That passer rating is almost 20 full points higher than Joe Flacco’s.